from pyspark.sql import SparkSession
from pyspark.sql.functions import col, when
2. Session 설정
## SparkSession 열기
# - SparkSession은 PySpark의 메인 진입점
# - master("local[*]") --> CPU 코어 전체 사용

spark = SparkSession.builder \
    .appName("PySpark_ML_Example") \
    .master("local[*]") \
    .getOrCreate()

print("SparkSession 생성 완료")
3. CSV 불러오기
df = spark.read.csv("data/Subjects.csv", header=True, inferSchema=True)
# - header=True : 첫 번째 행을 컬럼명으로 사용
# - inferSchema=True : 데이터 타입 자동 추론

print("CSV 파일 로드 완료")
df.show()
4. 데이터 전처리 작업
# ----------------------------------------------
# 데이터 전처리 및 파생 변수 생성
# ----------------------------------------------
# - 결측값은 0으로 대체
# - 총점(total) 및 합격 여부(pass) 컬럼 생성
# - 합격이면 1, 불합격이면 0

df = df.fillna({"kor" : 0, "eng" : 0, "math" : 0, "science" : 0})
df = df.withColumn("total", col("kor") + col("eng") + col("math") + col("science")) # y가 될 수 있는 값을 추가
df = df.withColumn("pass", when(col("total") >= 300, 1).otherwise(0))

print("데이터 처리 완료")
df.show()
# -----------------
# 회귀모델 (Linear Regression)
# -----------------
# - 입력 피치 : kor, eng, math, science
# - 타겟 : total
# - 목적 : 총점(total)을 예측하는 회귀모델

assembler = VectorAssembler(
    inputCols = ["kor", "eng", "math", "science"],
    outputCol = "features"
)

'''
Spark ML은 feature를 벡터 형태로 받아야 학습 가능
여러 컬럼(feature1, freature2 ...)도 한 컬럼(feature)에 합침
'''

train_df = assembler.transform(df).select("features", "total") # x(features), y(total) set

'''
featureCol : 독립 변수 벡터 컬럼
labelCol : 예측하려는 종속 변수
.fit(df) -> 회귀계수(weigth)와 절편(intercept)을 학습
'''

# 회귀 모델 생성 및 학습
lr = LinearRegression(featuresCol = "features", labelCol = "total")
lr_model = lr.fit(train_df)

# 예축 수행
'''
.transform(df) -> 학습된 모델로 df의 label 예측
'''

lr_predictions = lr_model.transform(train_df) # transform의 모델에 지정된 컬럼명으로 해줘야 오류가 나지 않음. 예) predictions(X) prediction(

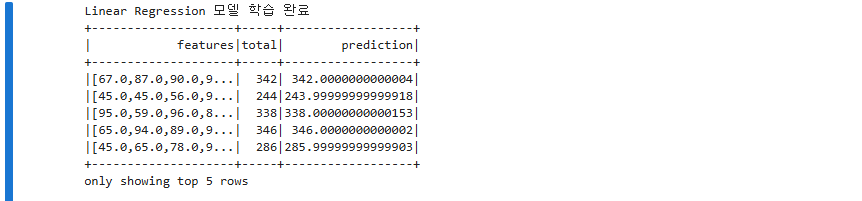
print("Linear Regression 모델 학습 완료")
lr_predictions.select("features", "total", "prediction").show(5) # 5줄만
SQL 쿼리로 total을 구한 것과, Linear Regression 모델을 학습시켜 total 값을 구한 것이 동일하게 나왔어요. 즉, 학습이 잘 되었다는 것을 의미하죠 😜
5-2. 분류 모델(Logistic Regression) - 2진 분류 모델
# ----------------------------------------
# 분류 모델(Logistic Regression)
# ----------------------------------------
# - 입력 피치 : kor, eng, math, science
# - 타겟 : pass(합격 여부)
# - 목적 : 합격(1)/불합격(0) 분류

assembler2 = VectorAssembler(
    inputCols = ["kor", "eng", "math", "science"],
    outputCol = "features"
)

train_df2 = assembler2.transform(df).select("features", "pass") # x, y set

# 분류 모델 생성 및 학습
logr = LogisticRegression(featuresCol = "features", labelCol = "pass") # 2진 분류 모델(LogisticRegression)
logr_model = logr.fit(train_df2)

# 예측 수행
logr_predictions = logr_model.transform(train_df2)

print("Logistic Regression 모델 학습 완료")
logr_predictions.select("features", "pass", "prediction", "probability").show(5, truncate=False)